3.1 Experimental sites
The buildings were built in the School of Science and Technology, Singapore’s Research Laboratory and the experiments were conducted in ADMT Studio 2 as the shake table was located there.
3.2 Experiment 1, Experiment 2 & Average result
Raw data is first shown in Table 1 to Table 6. 1st Average refers to the data recorded from the first test while 2nd average refers to that of the second test. Total average refers to the average of these two values. The data is then presented as graphs in Fig. 18 to 23.
Table 1. Results for Buildings with Beam Set 1 without Damper.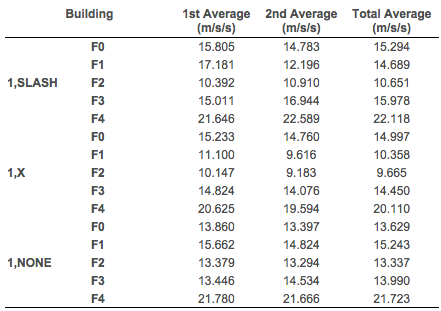
Table 2. Results for Buildings with Beam Set 2 without Damper.
Table 3. Results for Buildings with Beam Set 3 without Damper.
Table 4. Results for Buildings with Beam Set 1 with Damper.
Table 5. Results for Buildings with Beam Set 2 with Damper.
Table 6. Results for Buildings with Beam Set 3 with Damper.

Fig. 18. Comparison of Bracings for Buildings with Beam Set 1.

Fig. 19. Comparison of Bracings for Buildings with Beam Set 2.

Fig. 20. Comparison of Bracings for Buildings with Beam Set 3.

Fig. 21. Comparison of Beam Sets and Damper for Buildings with SLASH Bracings.

Fig. 22. Comparison of Beam Sets and Damper for Buildings with X Bracings.
Fig. 23. Comparison of Beam Sets and Damper for Buildings with NONE Bracings.
3.3 Special observations
For every building, the top floor oscillated the most as compared to the rest of the floors. This is because the oscillation waves is being reflected at the top part of the building. The frequency of an oscillation is closest to the natural frequency of the building, therefore, the top floor vibrated the most (Incorporated Research Institutions for Seismology, 2010).
No comments:
Post a Comment